Summary Dashboard
Overview of the Summary Dashboard and key metrics for feedback reports
Overview
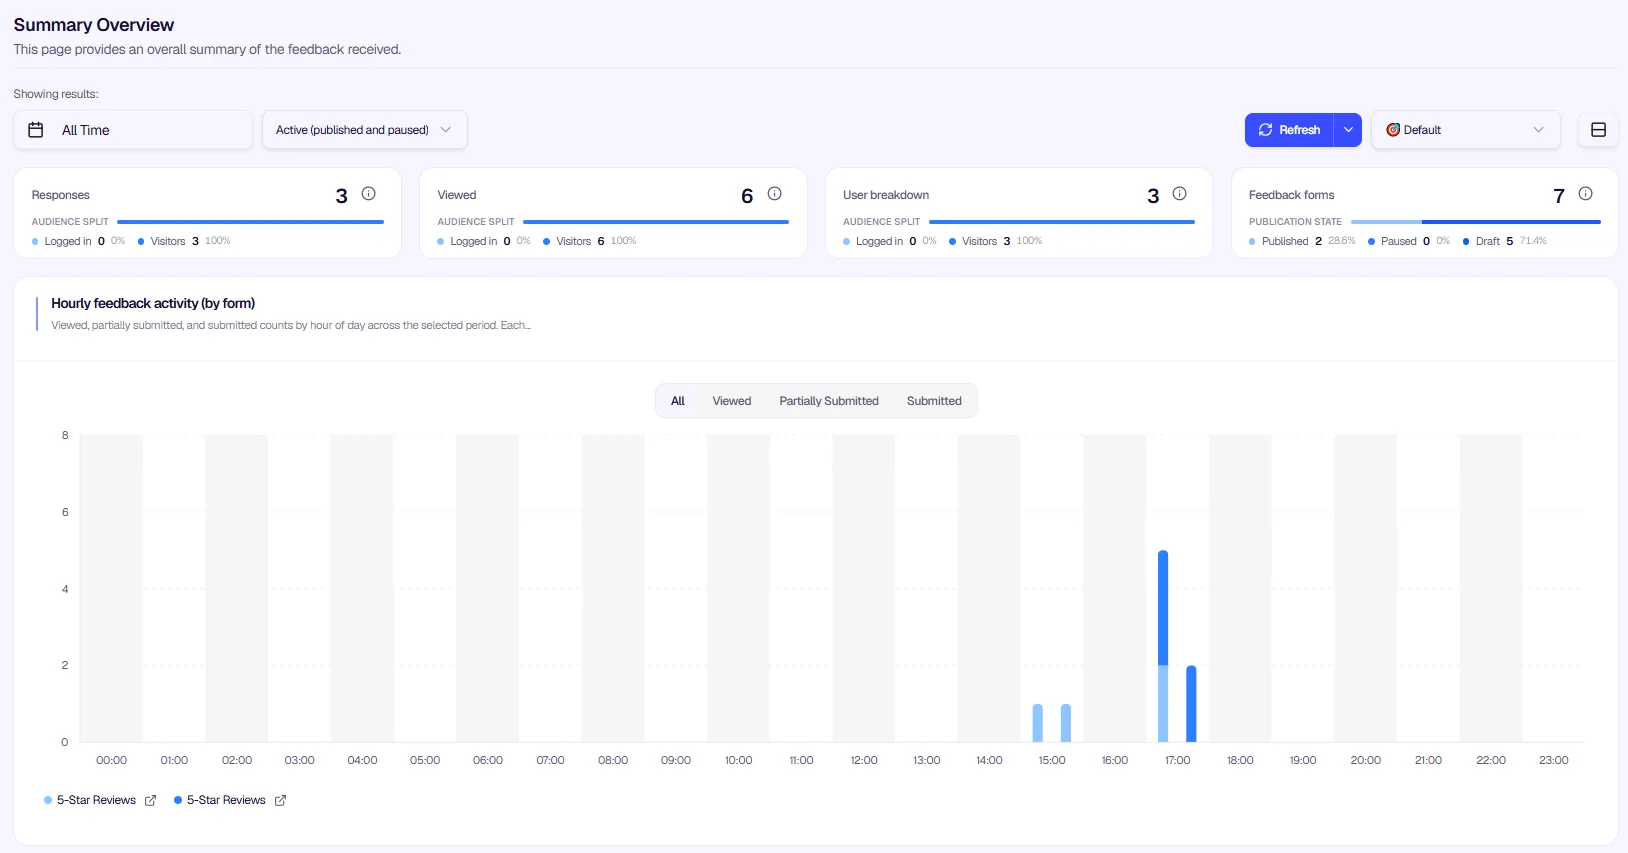
The Summary Dashboard provides an overall summary of the feedback received within your project. Use the date range selector at the top (e.g., "All Time" or a custom period) to filter the data and view metrics for your chosen timeframe. The dashboard aggregates all data project-wise, giving you a total summary based on the selected date range.
Data Summaries
The dashboard displays key metrics in summary cards at the top, each with an information icon (ⓘ) for additional details:
- Responses — Total number of feedback submissions received
- Viewed — Total number of times your feedback forms were viewed
- Identified Users — Number of users who submitted feedback while logged in or identified
- Unidentified Users — Number of users who submitted feedback anonymously
- Active Feedbacks — Number of feedback configurations currently active
These metrics update dynamically based on the selected date range, providing a project-wise total for the chosen period.
Chart Theme Customization
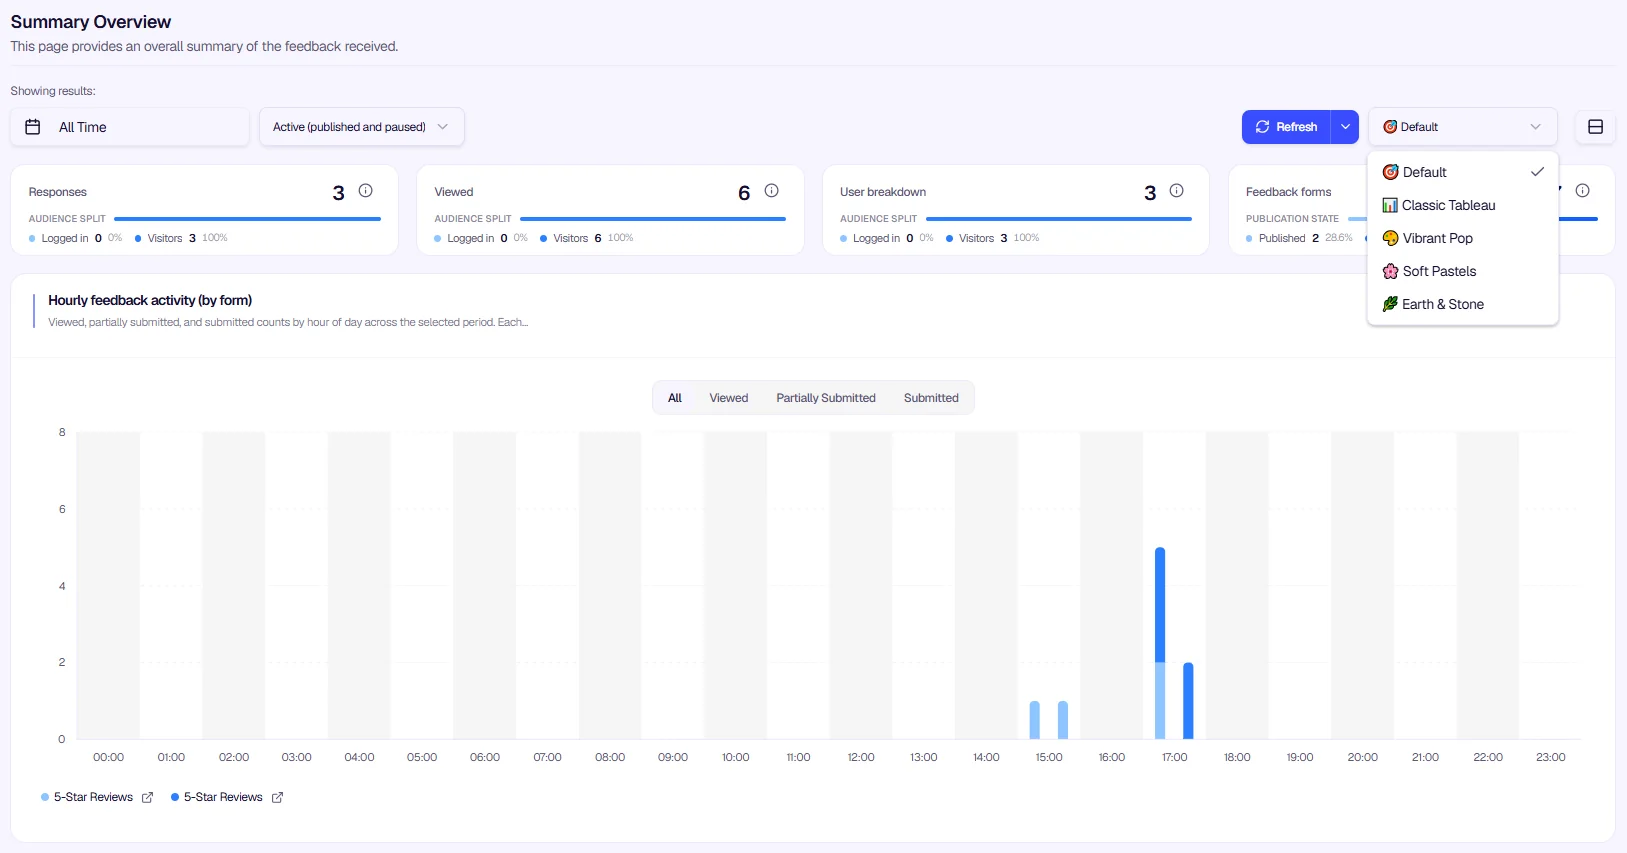
Admins can customize the visual appearance of the charts. Use the theme dropdown in the top right corner (next to the palette icon) to switch between options such as Default, Classic Tableau, Vibrant Pop, Soft Pastels, or Earth & Stone to match your preference.
Report Views
The Summary Dashboard includes the following report views:
- Views by Time (Daily) — Daily view counts for your feedback forms
- Submissions by Time (Daily) — Daily submission counts
- Engagement — User engagement metrics and conversion rates
- Channel Distribution — Breakdown by channel (web, mobile, etc.)
- Language Distribution — Feedback by user language
- Country Distribution — Geographic distribution of feedback
Use these reports together to understand who is seeing your forms, who is responding, and how engagement varies across channels, languages, and regions.
Was this page helpful?